Metrics & Reporting
For: managers and operations staff monitoring store performance
What you'll learn: how to open the Metrics Dashboard, pick a reporting period, read the performance cards, export the numbers, and run the Tax Reports page for filing.
This is a how-to guide for reading the dashboards, not the API. If you're building an automated reporting or analytics system instead, see the Usage Guide.
Before you start#
You'll need an admin login for your store. Two reporting pages live in the left navigation:
- Metrics — the main store-performance dashboard
- Tax Reports — sales-tax collection for accounting and compliance
If you don't see one of these, ask your administrator to grant access.
Throughout this guide, screenshots use a demo store — the names, orders, and amounts shown are fake. Amounts are shown as decimals: $1,234.56 appears as 1,234.56, never in cents.
1. Open the Metrics Dashboard#
Log in to the admin dashboard, then click Metrics in the left navigation.
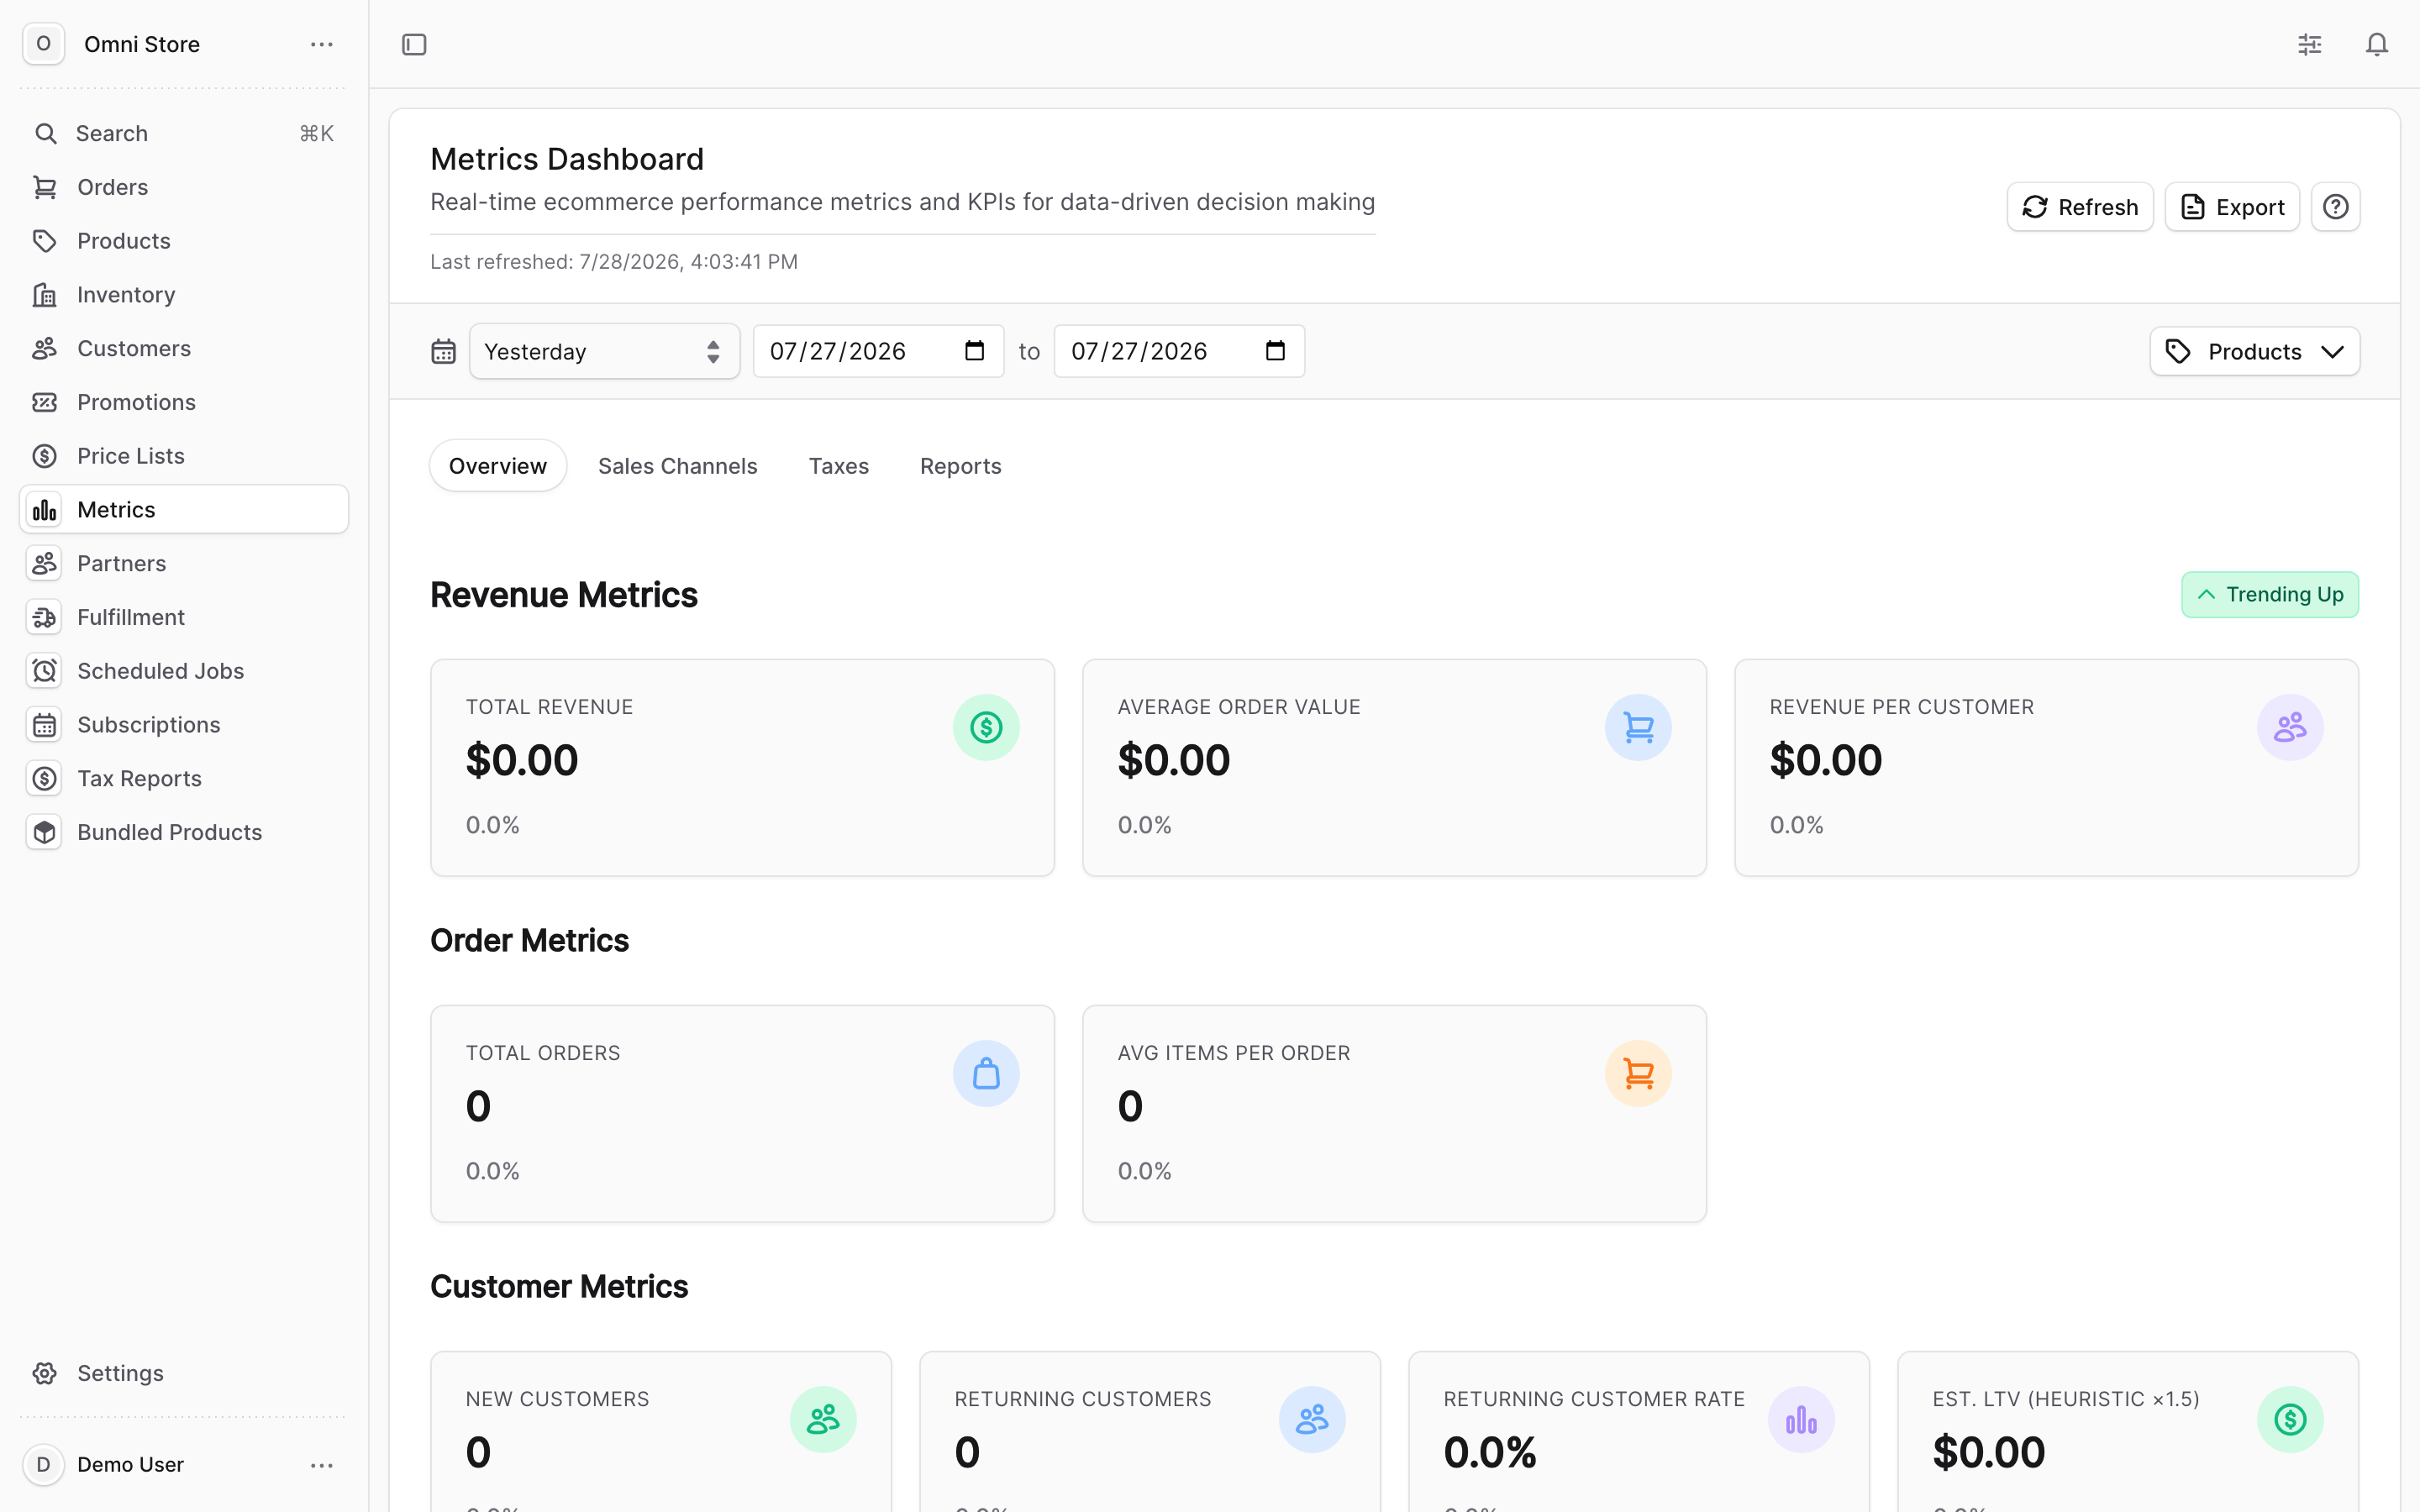
You'll land on the Metrics Dashboard — described on the page as "real-time ecommerce performance metrics and KPIs for data-driven decision making." Under the title you'll see a Last refreshed timestamp so you know how current the numbers are.
2. Choose your reporting period#
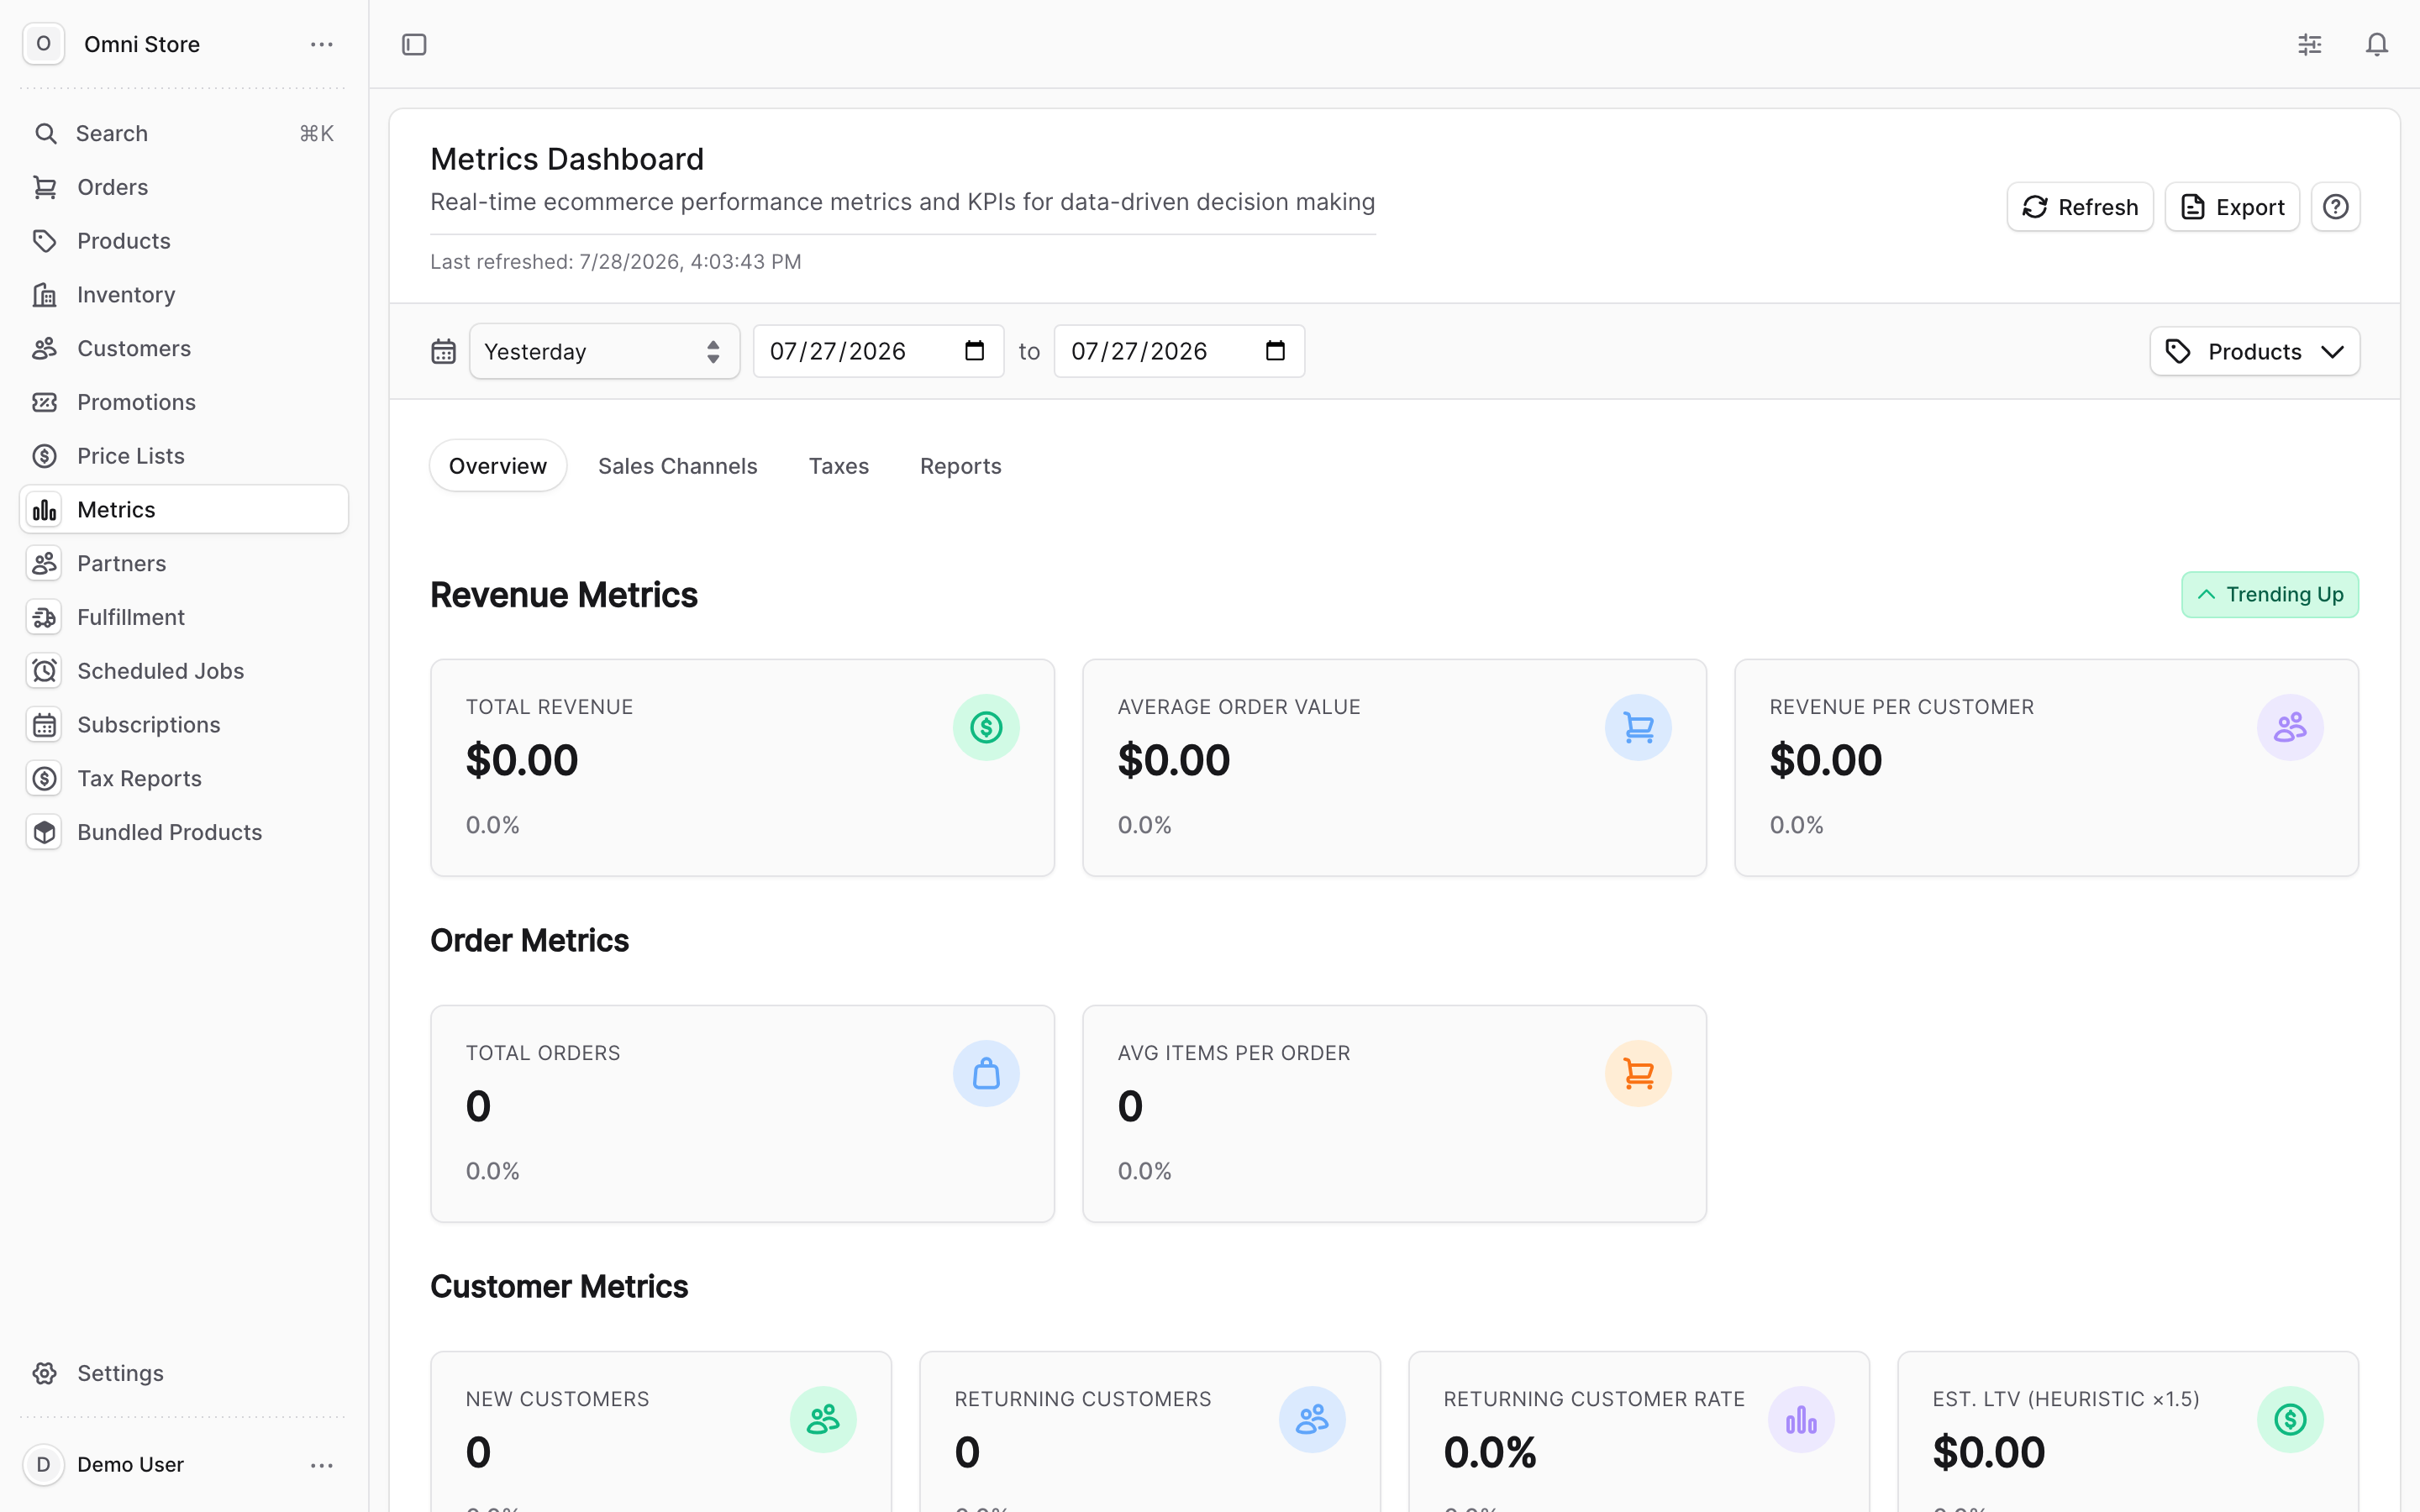
Below the header is a date range row. Click the date-range dropdown and pick a preset, or type start and end dates into the two date boxes labelled with to between them. The dashboard opens on Yesterday by default.
The dropdown offers these presets:
| Preset | Covers |
|---|---|
| Today | The current day |
| Yesterday | The previous day (the default) |
| Last 7 days | The trailing 7 days |
| Last 14 days | The trailing 14 days |
| Last 30 days | The trailing 30 days |
| Last 60 days | The trailing 60 days |
| Last 90 days | The trailing 90 days |
| This month | The first of this month through month-end |
| Last month | The whole previous calendar month |
| This quarter | The current calendar quarter |
| Custom | Set your own start and end dates |
Typing your own dates into the date boxes switches the dropdown to Custom automatically. Your last-used filter is remembered the next time you open the page.
Tip: Use Yesterday or Today for a quick daily check-in, and Last 30 days for weekly planning and performance reviews.
3. Narrow by product or sales channel#
On the right of the date row is a product and channel filter. Use it to limit the dashboard to a single sales channel or to specific products, so you can read performance for one storefront or product line instead of the whole store. Leave it on all to see everything.
4. Read the performance numbers#
The dashboard fills in below the filter row with summary cards and a sales-channel breakdown for the period you selected. Each summary card shows one number and, where a comparison period applies, a change indicator versus the earlier window.
To see exactly how any number is defined, click the question-mark (?) button in the top-right corner. This opens the Definitions & Best Practices panel, which explains each metric in plain language. A few worth knowing:
| Metric | What it means (from the definitions panel) |
|---|---|
| Total Revenue | The total money generated from sales in the selected period |
| Average Order Value (AOV) | Total revenue divided by the number of orders |
| Total Orders | Count of completed orders in the period |
| Unfulfilled Orders | Orders with captured payment but no shipment yet — excludes declined, refunded, or canceled orders |
| Refund Rate | Refunded amount as a percentage of revenue |
Caution: Fulfillment and shipping figures such as Total Shipped and Shipment Completion Rate count an order only once it has actually shipped (it has a shipped date). An order that is paid today but ships next week shows as Unfulfilled now and moves into the shipped figures later — so the two views won't always add up on the same day. Read the definitions panel before comparing numbers across periods.
5. Refresh and export#
Two buttons sit in the top-right of the Metrics Dashboard:
- Refresh — clears the cached figures and reloads them, then updates the Last refreshed timestamp. Use it when you know new orders have come in since you opened the page.
- Export — opens a small menu with two download options:
| Format | What you get |
|---|---|
| CSV (.csv) | Summary cards plus the sales-channel breakdown — opens in Excel or Google Sheets |
| JSON (.json) | The full loaded metrics object, for feeding into other tools |
Export uses the figures already on screen, so pick your period first, let the dashboard finish loading, then export. If nothing has loaded yet you'll see a prompt to open the dashboard before exporting.
Tip: Export a CSV weekly so you can line up week-over-week trends in a spreadsheet and prepare for seasonal peaks.
6. Run the Tax Reports page#
For sales-tax collection, click Tax Reports in the left navigation.
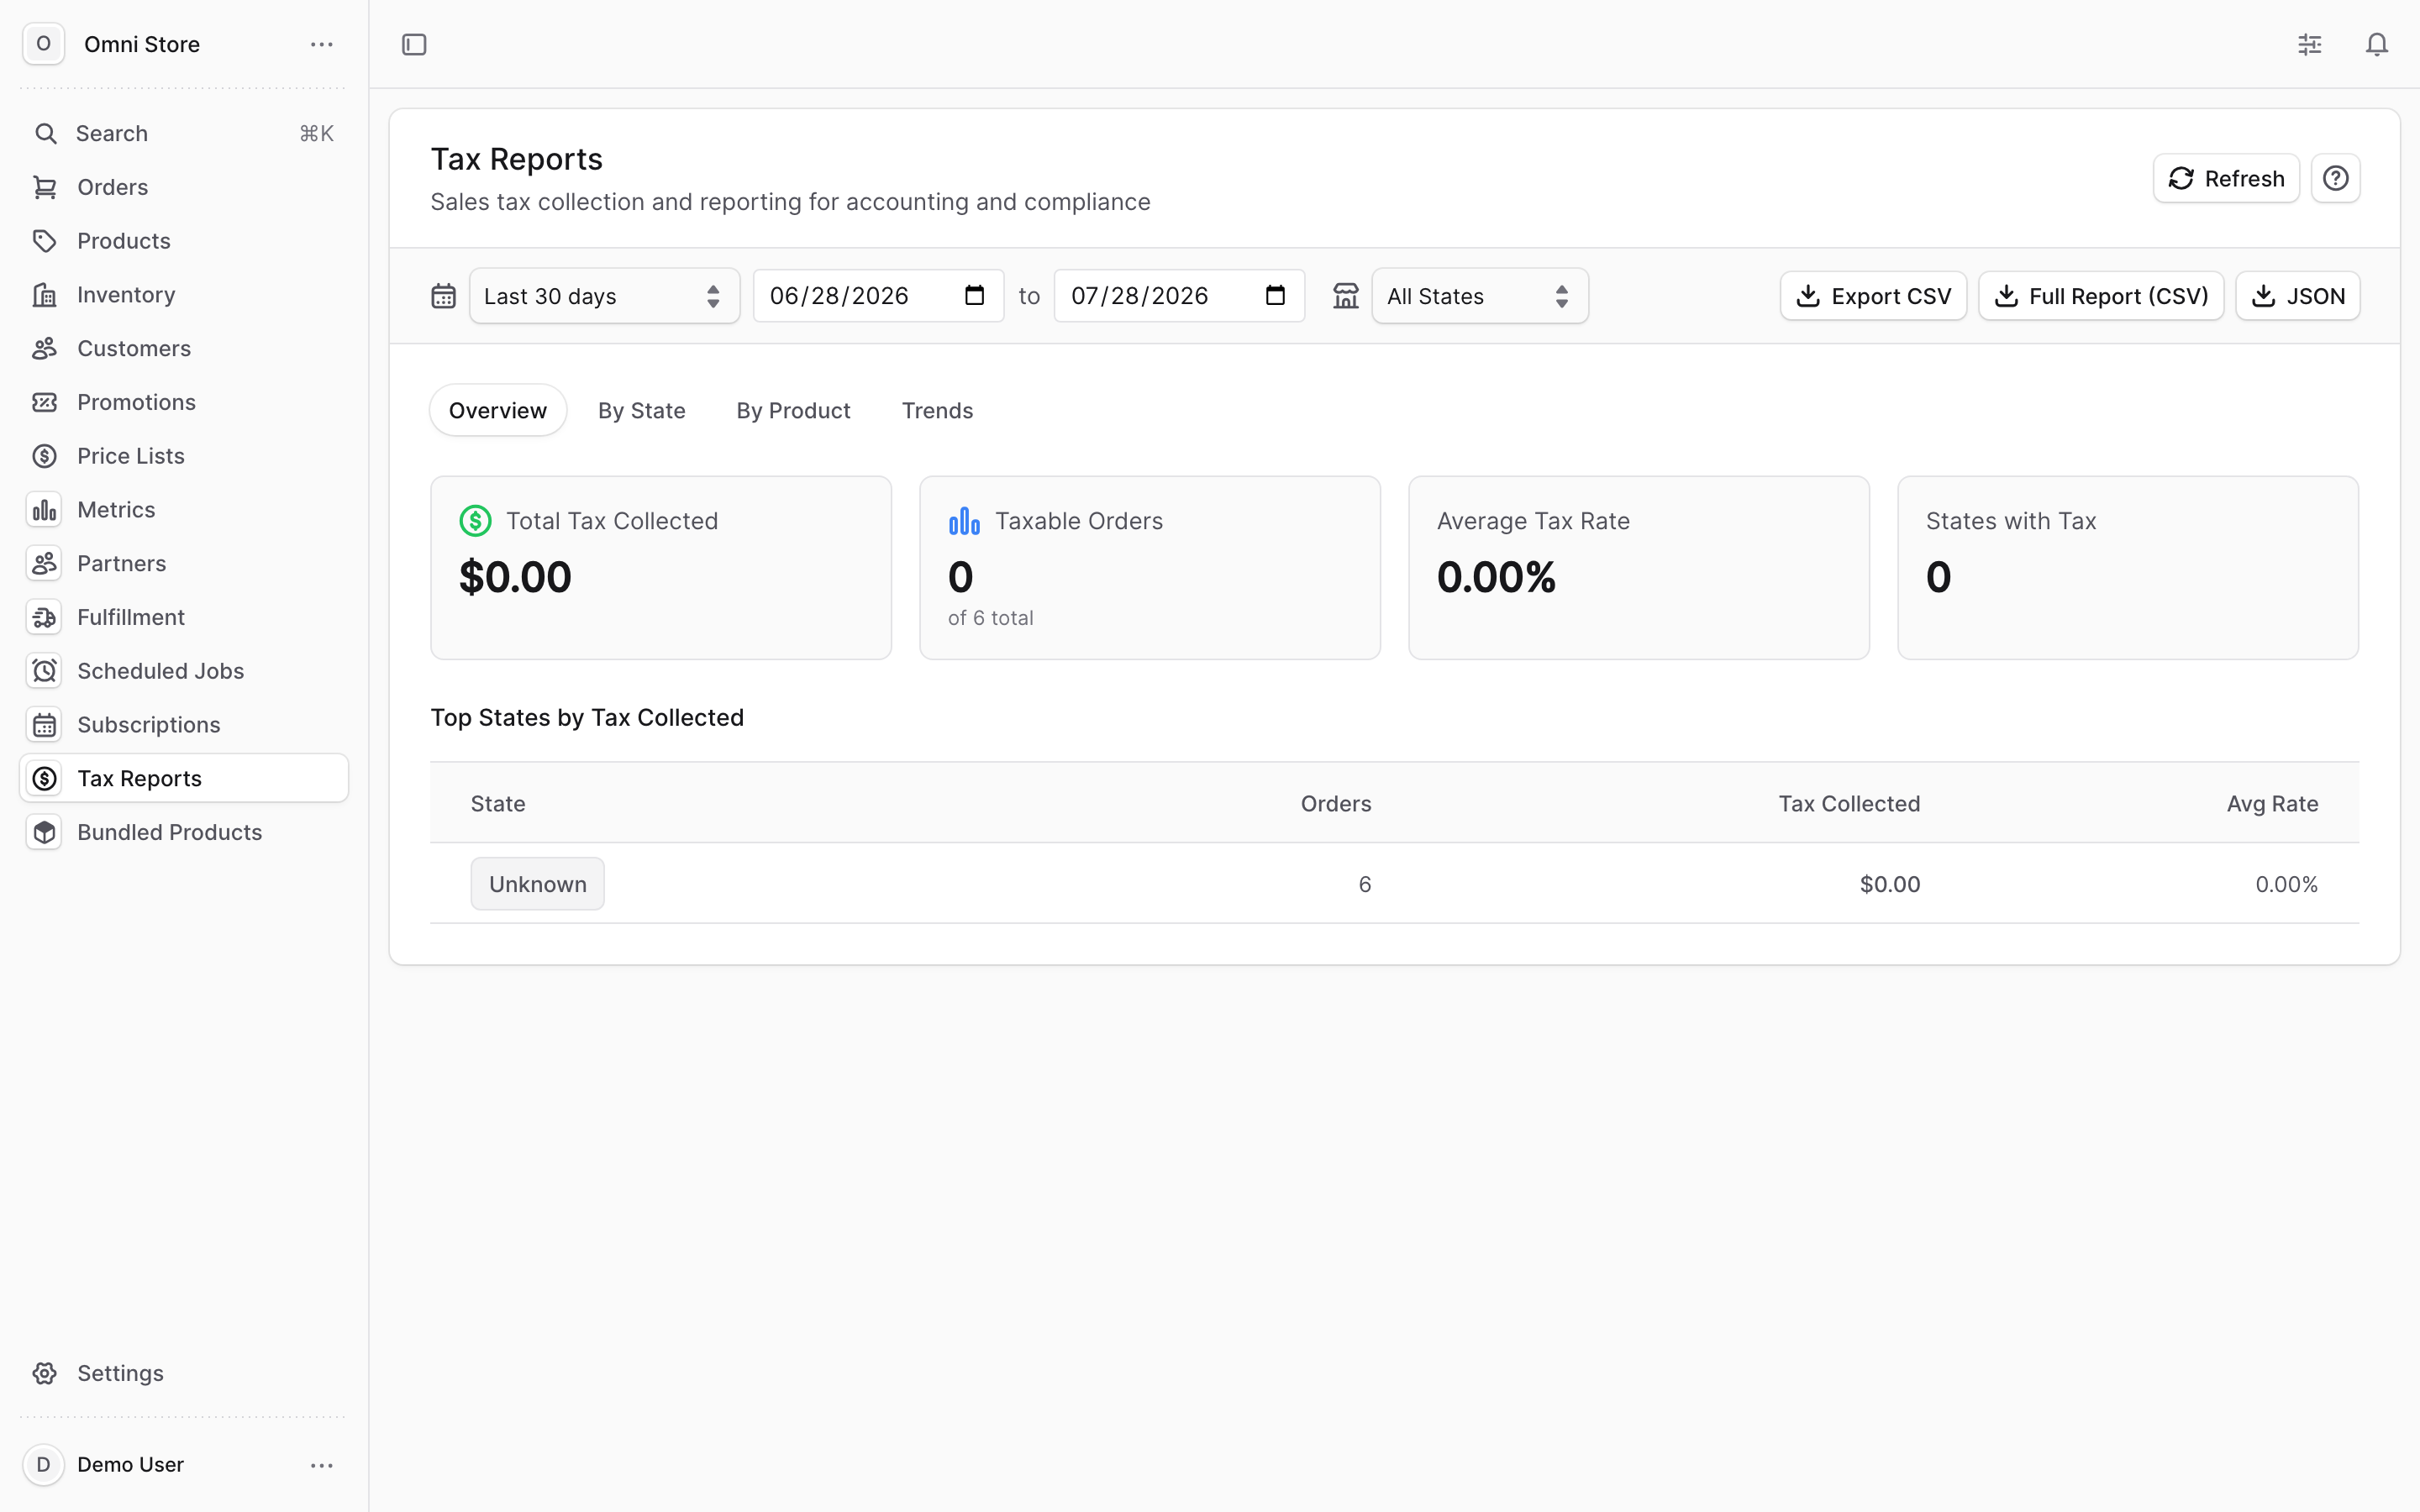
The page opens on the Last 30 days period. The filter row gives you:
- A date range dropdown with presets Today, Yesterday, Last 7 days, Last 30 days, Last 90 days, This month, Last month, This quarter, This year, and Custom — plus two date boxes for a custom range.
- A state filter to focus on a single state, or All States.
- Three export buttons: Export CSV, Full Report (CSV), and JSON.
Below the filters, four tabs organize the data:
| Tab | What you see |
|---|---|
| Overview | Summary cards — Total Tax Collected, Taxable Orders (out of total), Average Tax Rate, and States with Tax — plus a top-states table |
| By State | Every state with orders, tax lines, tax collected, and average rate, with a grand total |
| By Product | Top 20 products by tax collected |
| Trends | A monthly summary, and a daily summary when the date range is short |
The summary cards read: Total Tax Collected, Taxable Orders (shown out of the total order count), Average Tax Rate, and States with Tax.
For guidance on the export formats and filing, click the question-mark (?) button in the top-right to open the Help & Documentation panel.
Tip: When filing, export each state separately from the By State view, and keep the exported files for your records.
7. Interpret trends and act on them#
When you compare the same metric across periods:
- Rising revenue with steady orders → your average order value is climbing (higher-value baskets, add-ons, or price changes).
- Rising orders with flat or falling revenue → volume is up but each order is smaller (promotions or a shift in product mix).
- Falling revenue or orders → check whether fulfillment is syncing (see Fulfillment Operations) or whether it's a seasonal dip.
- A growing Unfulfilled Orders count → paid orders are stacking up unshipped; review inventory and fulfillment (see Fulfillment Operations).
Quick reference#
| Task | Where to go |
|---|---|
| See revenue and orders for yesterday | Metrics → the dashboard opens on Yesterday |
| Check last 30 days performance | Metrics → date dropdown → Last 30 days |
| Focus on one channel or product | Metrics → product and channel filter |
| Understand how a number is calculated | Metrics → question-mark (?) button |
| Download metrics for a spreadsheet | Metrics → Export → CSV |
| Review tax collected by state | Tax Reports → By State tab |
| Export tax data for filing | Tax Reports → Export CSV / Full Report (CSV) |
| Check whether fulfillment is syncing | Fulfillment Operations |
| Need API access instead | See the Usage Guide for automated reporting |